Measure Biopotential / ECG using Python on the Android Smartphone

Learn:

  • Analog Input
  • Biopotential

Warning: This application note is for learning and development only. It is not for Medical Diagnostic Use. Should be used solely by or under the supervision of qualified engineers and technicians who are familiar with the risks associated with handling electrical circuits.

An electrocardiogram (ECG or EKG, abbreviated from the German Elektrokardiogramm) records the electrical voltage in the heart in the form of a graph. It is the prime tool in cardiac electrophysiology, and its function is in the screening and diagnosis of cardiovascular diseases.

Requirements

  1. Python Py4A
  2. Bluetooth DAQ Starter Kit
  3. Hand-held Biopotential Electrodes Assembly

Note:

  1. Pair the EMANT380 to Android Smartphone.
  2. You will be asked to select the bluetooth MAC address for your EMANT380 module.
  3. You will have to change the MAINS_FREQ to 60 if your country mains frequency is 60Hz.
  4. To understand this program, you will require a knowledge of html and javascript. For more information, please read the guide to HTML scripts and using WebView APIs from code.google.com. There are 5 files in the Py4A folder
    • ecg_gui.py
    • peakdetect.py
    • graph.html
    • jquery.flot.min.js
    • jquery.min.js
  5. The peak detection module is modified for Py4A and used for the heart rate calculation. You can find the description here of the peak detection code.
  6. For the graph, we are using Flot, which is a pure Javascript plotting library for jQuery.
  7. For Android smartphone, all five files in the py4A folder should be stored in the SD Drive->sl4a->scripts folder.
  8. For Android emulator, only the the html and the 2 javascript files in the py4A folder should be stored in the SD Drive->sl4a->scripts folder.
  9. When you press any button, the Toast notification is used to indicate that the button event has been successfully processed. If you don't see the notification, try again. This is a limitation of the Py4A WebView API.


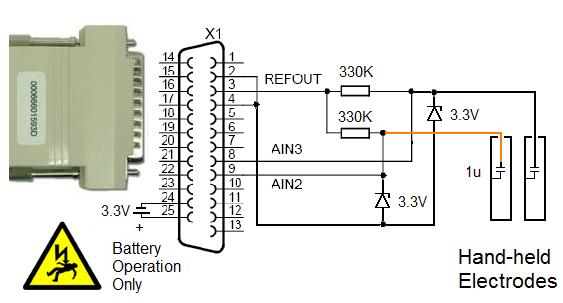
Fig 1: Connecting the EMANT380 Bluetooth DAQ to the Hand-held Biopotential Electrodes Assembly


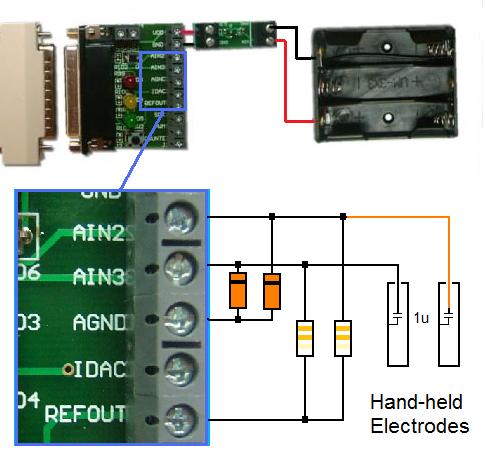
Fig 2: Connecting the Bluetooth Starter Kit to the Hand-held Biopotential Electrodes Assembly

The Hand-held Biopotential Electrodes are available for purchase. We recommend using them with the Bluetooth Starter Kit

ecg_gui.py

import android import json import math import emant import peakdetect droid = android.Android() droid.webViewShow('file:///sdcard/sl4a/scripts/graph.html') # change mains frequency if required MAINS_FREQ = 50 NOTCH_LENGTH_AVERAGE = 4 ScanRate = MAINS_FREQ * NOTCH_LENGTH_AVERAGE NumSamples = ScanRate * 2 + NOTCH_LENGTH_AVERAGE def NotchMains(ECGdata): filteredECG=[] for i in range(len(ECGdata)-NOTCH_LENGTH_AVERAGE): filteredECG.append((sum(ECGdata[i:(i+NOTCH_LENGTH_AVERAGE)])/NOTCH_LENGTH_AVERAGE)) return filteredECG def format4Flot(myData): proData=[] for i in range(len(myData)): proData.append([i/float(ScanRate),myData[i]]) return proData m = emant.Emant300() m.Open() r,actScanRate = m.ConfigAnalog(1, emant.Emant300.Bipolar, ScanRate) loop=True reading=[] shr="none" while loop: e = droid.eventWaitFor('check').result if (e['data']=='timer'): # read waveform ECGdata = m.ReadAnalogWaveform(emant.Emant300.AIN2,emant.Emant300.AIN3, NumSamples) reading = NotchMains(ECGdata) # calculate heart rate try: thresh = (max(reading)-min(reading))/2 maxlist, minlist = peakdetect.peakdet(reading,thresh) ym = map(list,zip(*maxlist)) if len(ym[0])>=2: diff=[] for i in range(len(ym[0])-1): diff.append(ym[0][i+1]-ym[0][i]) hr = sum(diff)/len(diff) shr = str(ScanRate*60/hr) else: shr = "none" except IndexError: shr = "none" # display results data={} data['hr']=shr data['wf']=format4Flot(reading) droid.eventPost("respond",json.dumps(data)) else: droid.makeToast(e['data']) loop = not(e['data']=="quit") m.Close()

graph.html

<html> <head> <title>ECG Graph demo</title> <script language="javascript" type="text/javascript" src="jquery.min.js"></script> <script language="javascript" type="text/javascript" src="jquery.flot.min.js"></script> <!-- (c) 2011 Emant Pte Ltd --> </head> <body> <h1>ECG Graph</h1> <div>Heart Rate (BPM): <div id="ehr" style="display: inline;"/></div> <div id="egraph" style="width:300px;height:300px;"></div> <div> <button id="start" onClick='timerstart();'>Start</button> <button id="stop" onClick='timerstop();'>Stop</button> <button id="quit" onClick='quit();'>Quit</button> </div> <p>This example uses the <b>flot</b> library</p> <script type="text/javascript"> var timerOn = 0; var timerInterval = 2500; var droid = new Android(); var display = function(result) { var json_data = eval("(" + result.data + ")"); $.plot($("#egraph"), [json_data.wf]); document.getElementById("ehr").innerHTML = json_data.hr; } droid.registerCallback("respond", display); function timerstart(){ droid.eventPost("check", "timer"); timerOn = setInterval(function() { droid.eventPost("check", "timer"); }, timerInterval); } function timerstop(){ clearInterval(timerOn); droid.eventPost("check", "stop"); } function quit(){ clearInterval(timerOn); droid.eventPost("check", "quit"); } </script> </body> </html>

Scan the script to your smartphone using the Test EMANT380 app or download to PC/Emulator

ecg.zip